
Getting Started
Quality Score and Coverage Rate Are Not the Same Thing
A quality score is only as valid as the calls that are measured.
In a sample-based program, the quality score can rise while the coverage rate stays flat. If unheard calls contain regulatory violations, recurring misinformation or cancellation signals, these findings never make it into any report.
This guide covers CX Quality through its product screens. It explains how criteria are defined, which questions the dashboard answers, how the agent breakdown is read and how coaching output is generated. The screens and numbers in Section 05 come from a real customer operation’s POC process.
Section 01
Coverage Rate: How Many of Your Calls Are Measured?
The quality score only represents the conversations that are listened to.
An agent handles an average of 5,000 minutes of calls per month. In the industry, about 3% of these conversations are listened to and scored.
The rate stays at this level because of capacity, not choice. A quality specialist spends an average of 8 minutes listening to a single conversation and filling in the form, and has 160 working hours a month. In an operation handling 10,000 conversations a month, these two numbers mean listening to every call would require 8 full-time specialists. For the remaining 97%, no quality data is produced at all.
Calculator
Your own coverage rate
Enter your own numbers. When you add the specialist cost, the annual staffing cost needed to manually listen to every call is calculated too.
Your coverage rate
Each square represents 1% of total conversations.
Number of red squares: 3.
Theoretical calculation: minutes are divided by 60 to convert to hours; the result is divided by 160 monthly hours per specialist.
Section 02
What Are You Missing in Unheard Conversations?
7 signals found only inside the conversation.
- 01Regulatory and Data Security Violations
Mandatory disclosures are skipped and personal data is shared against the rules.
- 02Regularly Skipped Criteria
An agent skips the same criterion every day and nobody notices.
- 03Recurring Misinformation
A rule learned incorrectly is passed on the same way to hundreds of customers.
- 04Customer Churn Statements
“I want to cancel” is said before the cancellation happens.
- 05Reasons for Repeat Contact
A customer calling for the third time about the same issue says what was missing in the first call.
- 06Product and Price Feedback
The clearest comments about the product are said on the phone and never reach the product team.
- 07Unanswered Sales Opportunities
The customer clearly shows interest, and the opportunity is never recorded.
Section 03
The Arithmetic of Coverage
The staffing option closes beyond a certain scale.
Theoretical calculation
(Monthly Conversations × Evaluation Minutes) ÷ 60 ÷ 160
÷ 60 converts minutes to hours; ÷ 160 divides the result by a specialist’s monthly working hours.
| Monthly Conversations | Time Needed | Theoretical Staff |
|---|---|---|
| 2,000 | 267 hours | 1.7 specialists |
| 10,000 | 1,333 hours | 8.3 specialists |
| 50,000 | 6,667 hours | 41.7 specialists |
The calculation assumes an evaluation time of 8 minutes per conversation. It is a theoretical reference and cannot be used as a staffing plan.
Beyond a certain scale, full coverage is no longer a budget decision. It is an arithmetic limit.
Section 04
You Define the Criteria, the System Does the Evaluation
You write the criteria and update them whenever you want; the standard stays the same on every call.
An operation doesn’t have a single quality form: separate forms are used for inbound calls, cross-selling and collections, and each form contains dozens of criteria. In CX Quality, a criterion is defined with the 6 fields shown on the screen below.
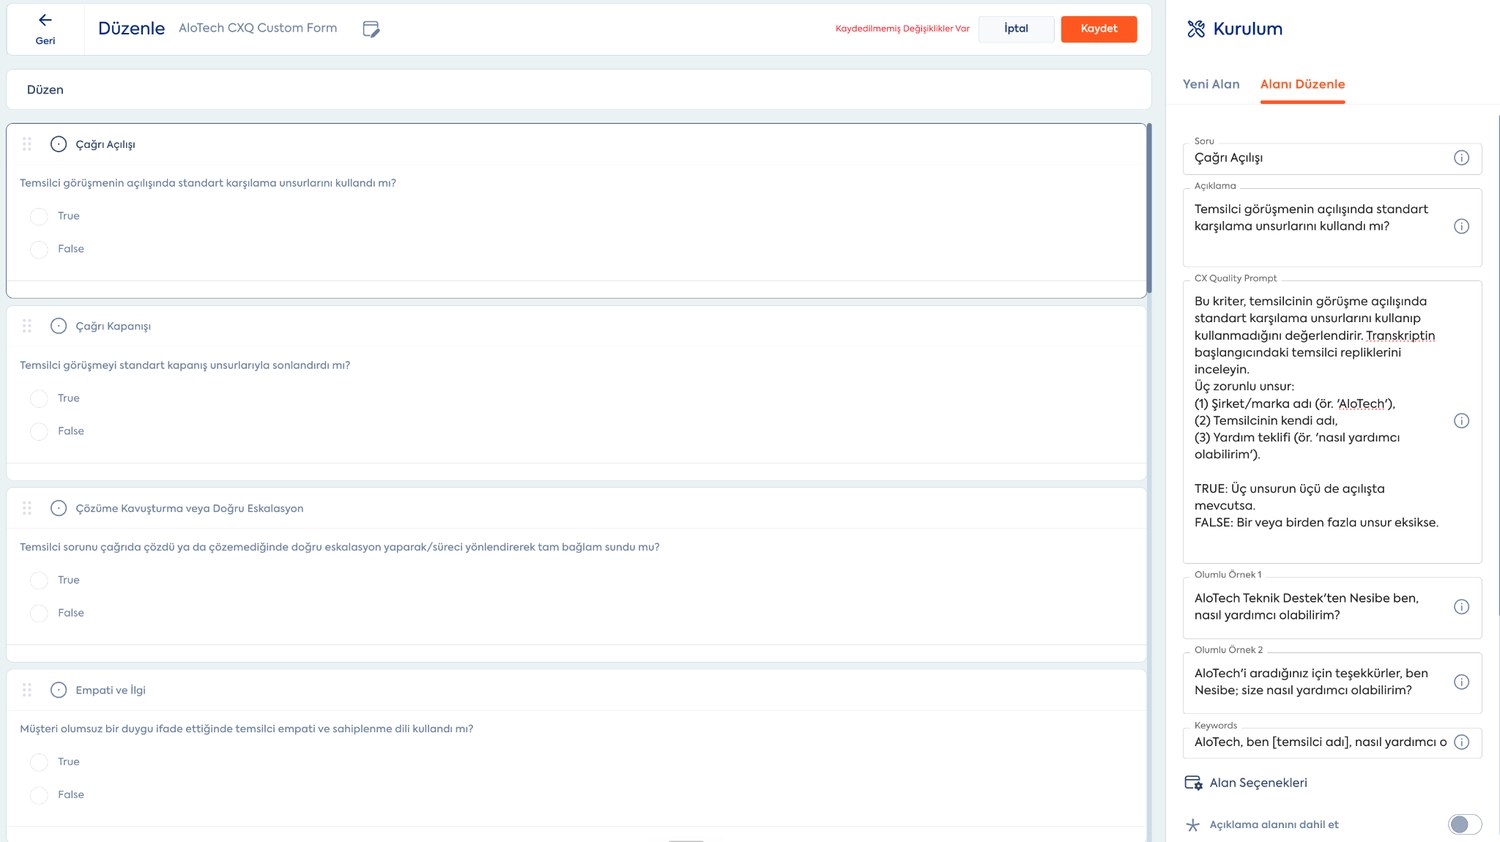
As soon as a criterion is activated, 100% of calls, not 3%, are evaluated against the same standard. Who does the evaluation and when doesn’t affect the result.
Sample Criteria Set
The set below consists of criteria running in a real customer operation.
| Criterion | What Does It Measure? |
|---|---|
| Call Opening | Were the company name, the agent’s name and an offer of help used together in the opening? |
| Call Closing | Was the conversation ended with the standard closing elements? |
| Resolution or Correct Escalation | Was the issue resolved within the call; if not, was it escalated to the right unit with the context handed over? |
| Empathy and Attention | When the customer expressed a negative emotion, was empathetic and ownership language used? |
| Technical Competence and Subject Knowledge | Is the information given to the customer accurate and up to date? |
Criterion names, definitions and score weights are specific to the operation; CX Quality doesn’t impose a ready-made template. Criteria considered critical can also be flagged: when such an item is skipped, the call’s score drops straight to zero and risky conversations move to the top of the list.
Section 05
What Happened in a Real Operation?
POC data: 1,438 calls, 13 agents.
The screen below comes from a real customer operation. At the start of the POC, quality processes were stable: the team was competent and supervisors were following up regularly. Even so, the criteria average had stayed flat at 61.36%.
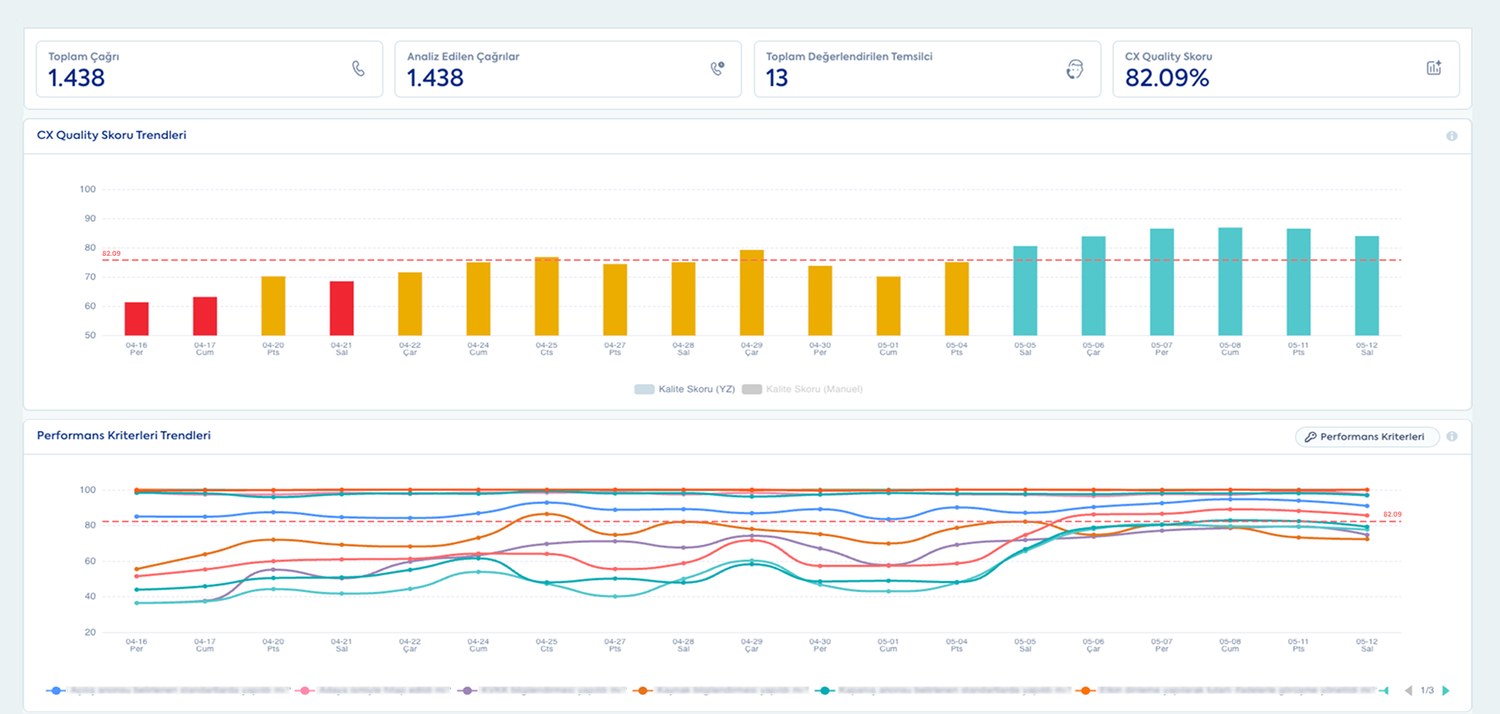
Why the average stayed at this level became clear once every call was analyzed: certain agents were regularly skipping certain criteria, and this never showed up in sample-based evaluation. The finding was spotted on the dashboard in the first week and the team took action.
The comparison below shows the same dashboard on April 16 and May 12. The process, the team and the criteria set were the same on both dates.
The clearest example is the criterion “Were the standard questions asked to the candidate for the appointment?”. On April 16, this criterion’s score was 36.42%; more than half of the agents were closing the call without asking the standard questions they should have. 4 weeks later, the same criterion rose to 77.62%.
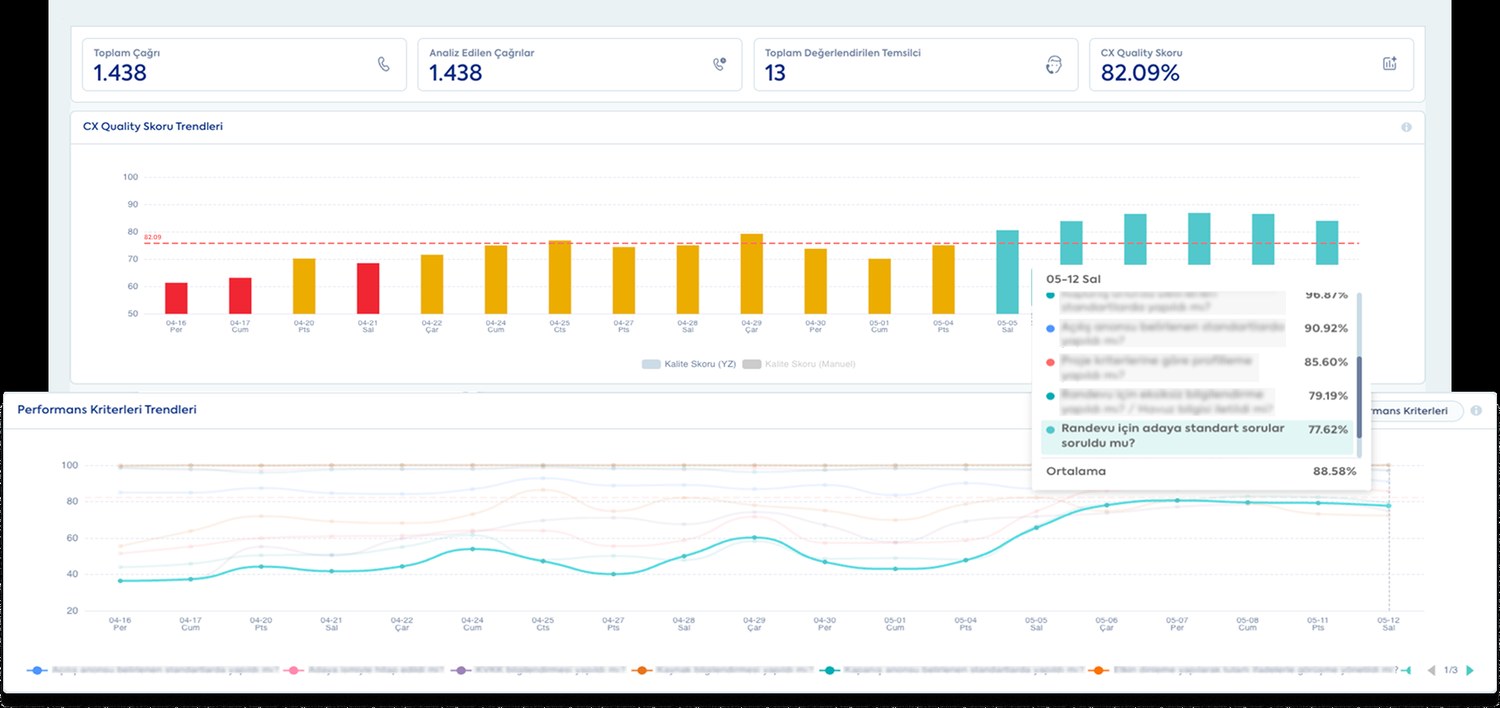
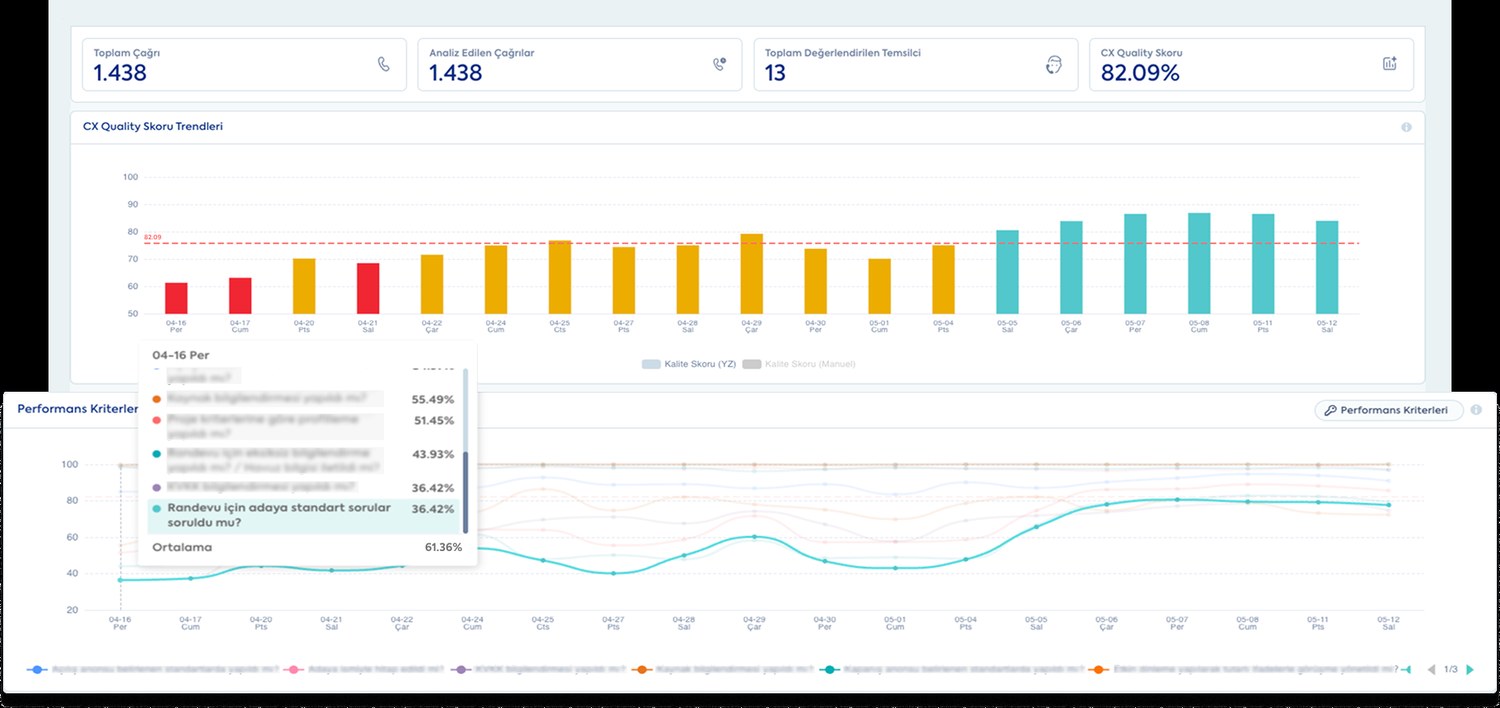
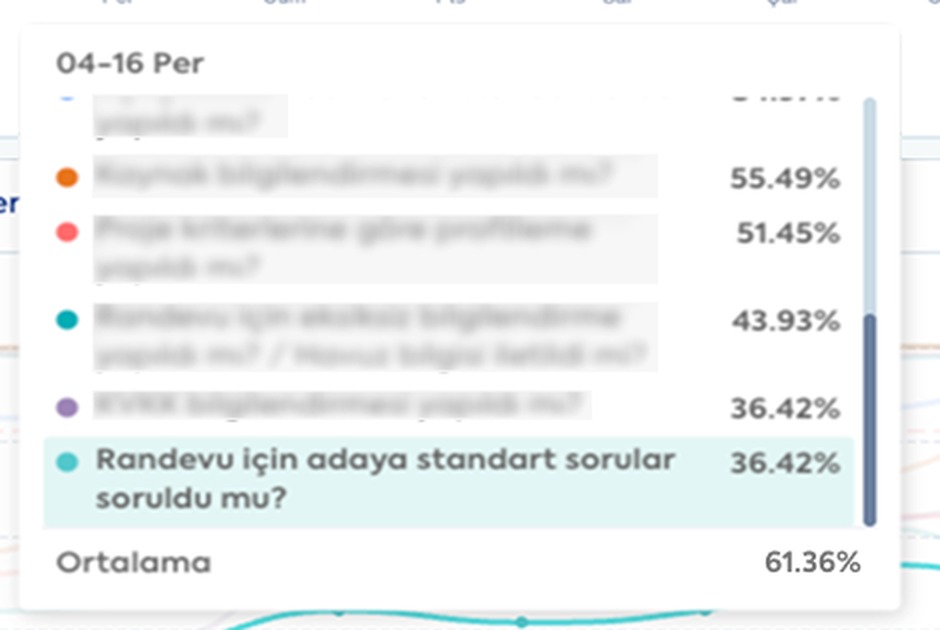
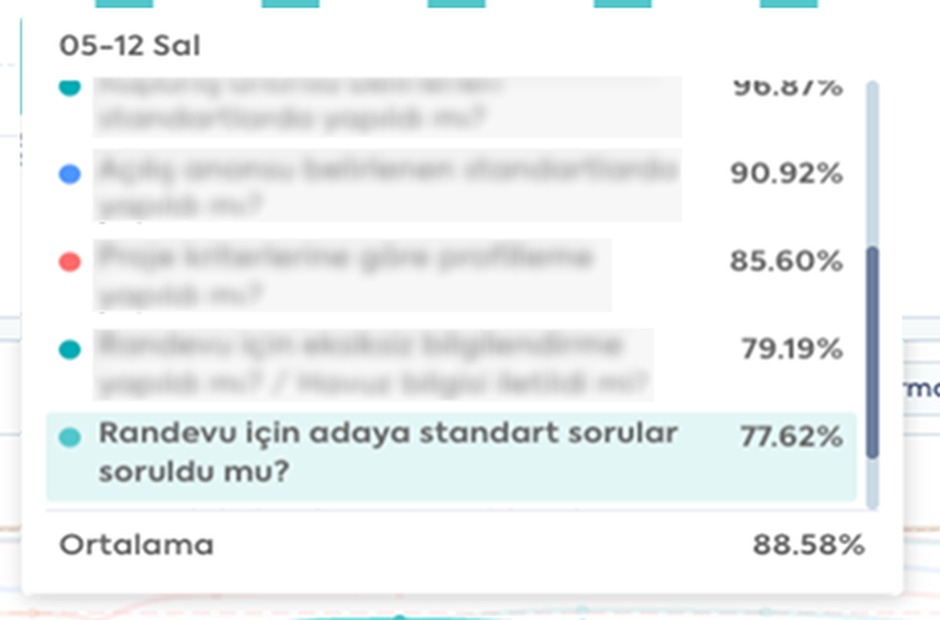
Whichever date you slide to, that date’s criteria list comes to the front.
An unmeasured call is an unmanageable operation.CX Quality It showed what to fix in 4 weeks.
Section 06
Which Agent Struggles Where?
Is the problem across the operation, or with a few agents?
Once the criterion that needs improvement across the operation is identified, the second question comes up: which agents are struggling with this criterion?
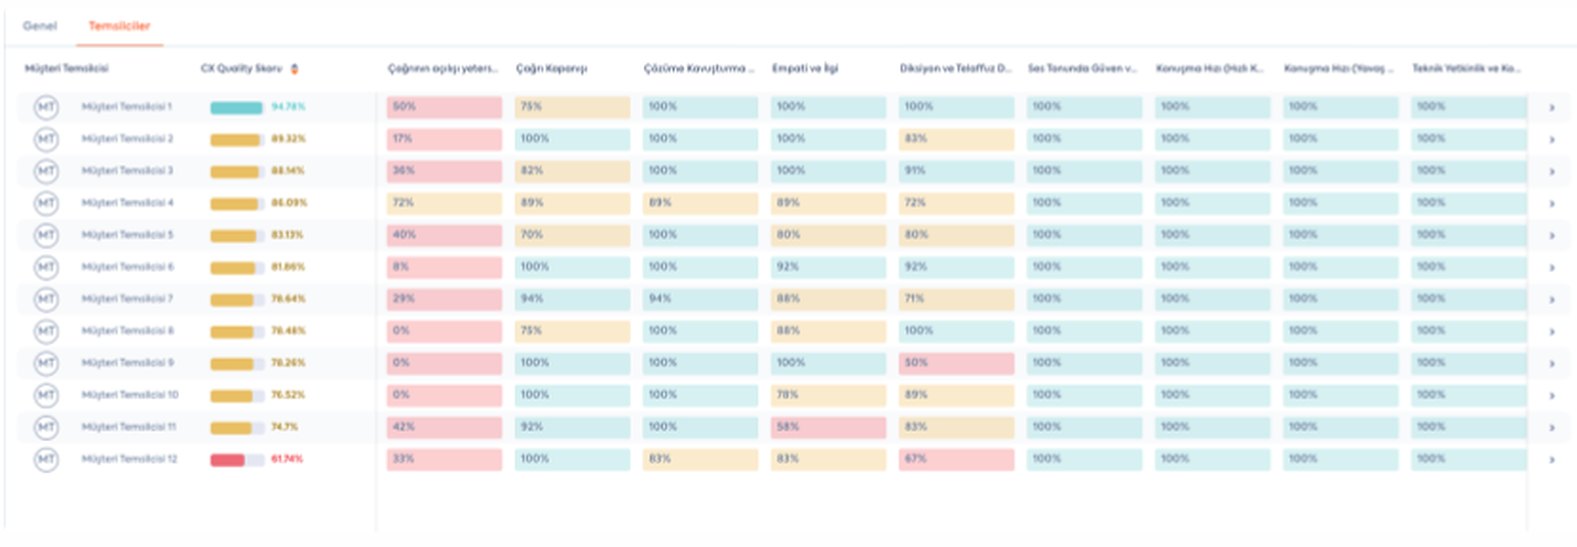
A single column shows whether a criterion is low across the operation or specific to a few agents. In the example above, some agents are at 0% on the call opening criterion and others at 72%. This distinction determines whether the action should be classroom training or individual coaching.
Section 07
Agent-Specific Coaching and the Right Action
Alongside the score, it also identifies which action belongs to whom.
After analyzing every call, CX Quality doesn’t just report the criterion score; it also produces coaching output for each agent.
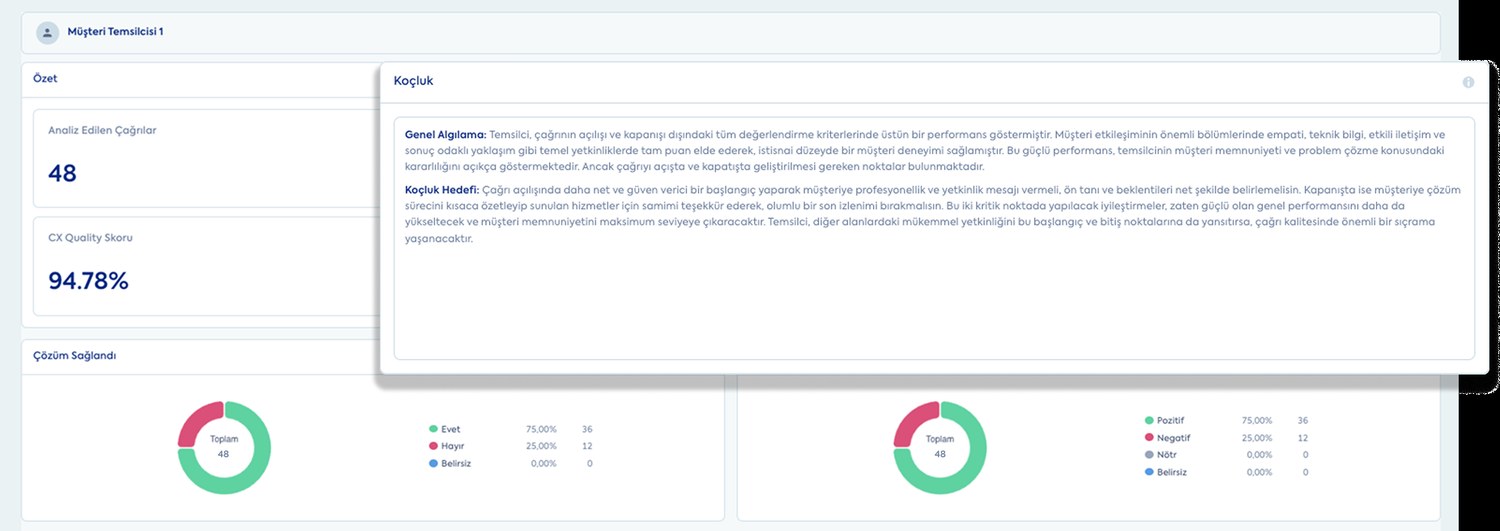
The overall assessmentsummarizes which criteria the agent is strong in. The coaching goal defines which behavior should change and how. In this example, two goals are given: a clearer start in the opening, and summarizing the resolution process at the close.
The same page also shows the agent’s number of analyzed calls, quality score, resolution rate and customer sentiment distribution.
The quality team doesn’t listen to recordings; it focuses on improvement
This output comes ready for every call. Hundreds of hours of listening and form-filling disappear; the quality team’s time shifts from collecting scores to coaching conversations.
Reading the Signal
Not every finding is a coaching topic for an agent. The same signal requires a different action depending on its source; to connect coaching output to the right place, the root cause of the finding is separated out.
| Signal Seen | First Assumption | Where to Look |
|---|---|---|
| The same misinformation is repeated by many agents. | Agents aren’t paying attention. | The knowledge base, training content and the owner of that information. |
| The repeat contact rate is rising on a topic. | Conversations aren’t being closed well. | The resolution flow and the agent’s authority limits. |
| Cancellation statements cluster around price. | Agents can’t persuade customers. | The product and offer side. |
Section 08
Are You Tracking Your Operation’s Quality?
How many of the 15 statements below can you make today?
| Score | Level |
|---|---|
| 0-4 | Reactive |
| 5-8 | Structured |
| 9-12 | Measurable |
| 13-15 | Predictive |
Whatever your score, the next step is the same
All 15 items become answerable once every call is measured. Request a demo to see where you stand in your own operation.
Next step
See It in Your Own Calls
This isn’t a case study; it’s your operation.
Only your own calls show which criterion is at what level in your operation and which agent struggles where.
AloTech CX Quality
- Every CallNot a sample: 100% full coverage.
- Consistent ResultsThe same criterion, the same standard on every call.
- Your Own CriteriaNo ready-made template; you write the form.
- Criterion and Agent BreakdownDrills down beneath the total score.
- Coaching RecommendationIt also writes what to do.
- Critical Errors Tracked SeparatelyConversations that hit an autofail don’t blend into the average.
AloTech is a cloud contact center infrastructure that brings voice and digital channels together with AI technologies on a single platform. According to the company’s public statements, it works with more than 700 organizations in Türkiye, serves in more than 60 countries and maintains a customer churn rate below 2%, which is considered low in the SaaS industry.
Tailored to you
Your criteria, your calls
CX Quality doesn’t apply a ready-made scoring template. You write the criteria and flag the critical items; evaluation is done in the language of your operation.
POC result · criteria average
61.36%+27.2 points44% increase
after 4 weeks
April 16May 12
+27.2 points in 4 weeks. The same team, the same criteria; the only thing that changed was that every call was measured.
Demo request
Let Our Teams Reach You Right Away
Let’s work through your own calls, your own criteria and your own numbers.
Request a CX Quality demoQuestions
Frequently Asked Questions
The 8 most frequently asked questions when evaluating the solution.
- Can We Define Our Own Quality Form?
Yes. You set the criteria, descriptions, example sentences and score weights; you don’t have to fit a ready-made template.
- Can We Update the Form Later?
Yes. Criteria are updated from the form editing screen; new criteria can be added and existing ones changed or removed.
- Can I Mark My Critical Criteria as Autofail?
Yes. Autofail is a criterion flag that invalidates the whole call when it is skipped; instead of deducting points, it drops the score straight to zero. Items such as failing to read a mandatory disclosure or skipping identity verification are defined this way. Conversations that hit an autofail are reported separately from the weighted average and move to the top of the risky conversations list.
- Can I Measure Agent Performance?
Yes. For each agent, you see scores by criterion, resolution rate and customer sentiment distribution; agents are ranked by total score.
- Can I Compare My Own Scores with AI Scores?
Yes. On the dashboard, the quality score is tracked separately for AI and manual evaluation; the two results can be compared over the same period.
- Does CX Quality Offer Coaching for My Agents?
Yes. An overall assessment and coaching goal are generated for each agent; which behavior should change and how is written with call examples.
- Can We See the Reasoning Behind the Score?
Yes. The result of each criterion is shown together with the part of the conversation it is based on; no score is left without reasoning.
- Can We Test with Our Own Calls?
Yes. The demo process runs on your own recordings and your own criteria; you see the results before you decide.
Demo request
See the Answer in Your Own Calls
Walk into your next quality meeting with data from all your calls, not a sample.
Request a CX Quality demo